

Direct Acyclic Graphs (DAGs)
The history of graphical causal modeling goes back to the early 1900s and Sewall Wright, one of the fathers of modern genetics and son of the economist Philip Wright. Sewall developed path diagrams for genetics, and Philip, it is believed, adapted them for econometric identification (Matsueda 2012; Cunningham 2021). DAGs causally run in one direction and are a visual representations of a chain of causal effects. Arrows represent a causal effect between two variables moving in the direction of the arrow. The direction of the arrow captures the direction of causality.
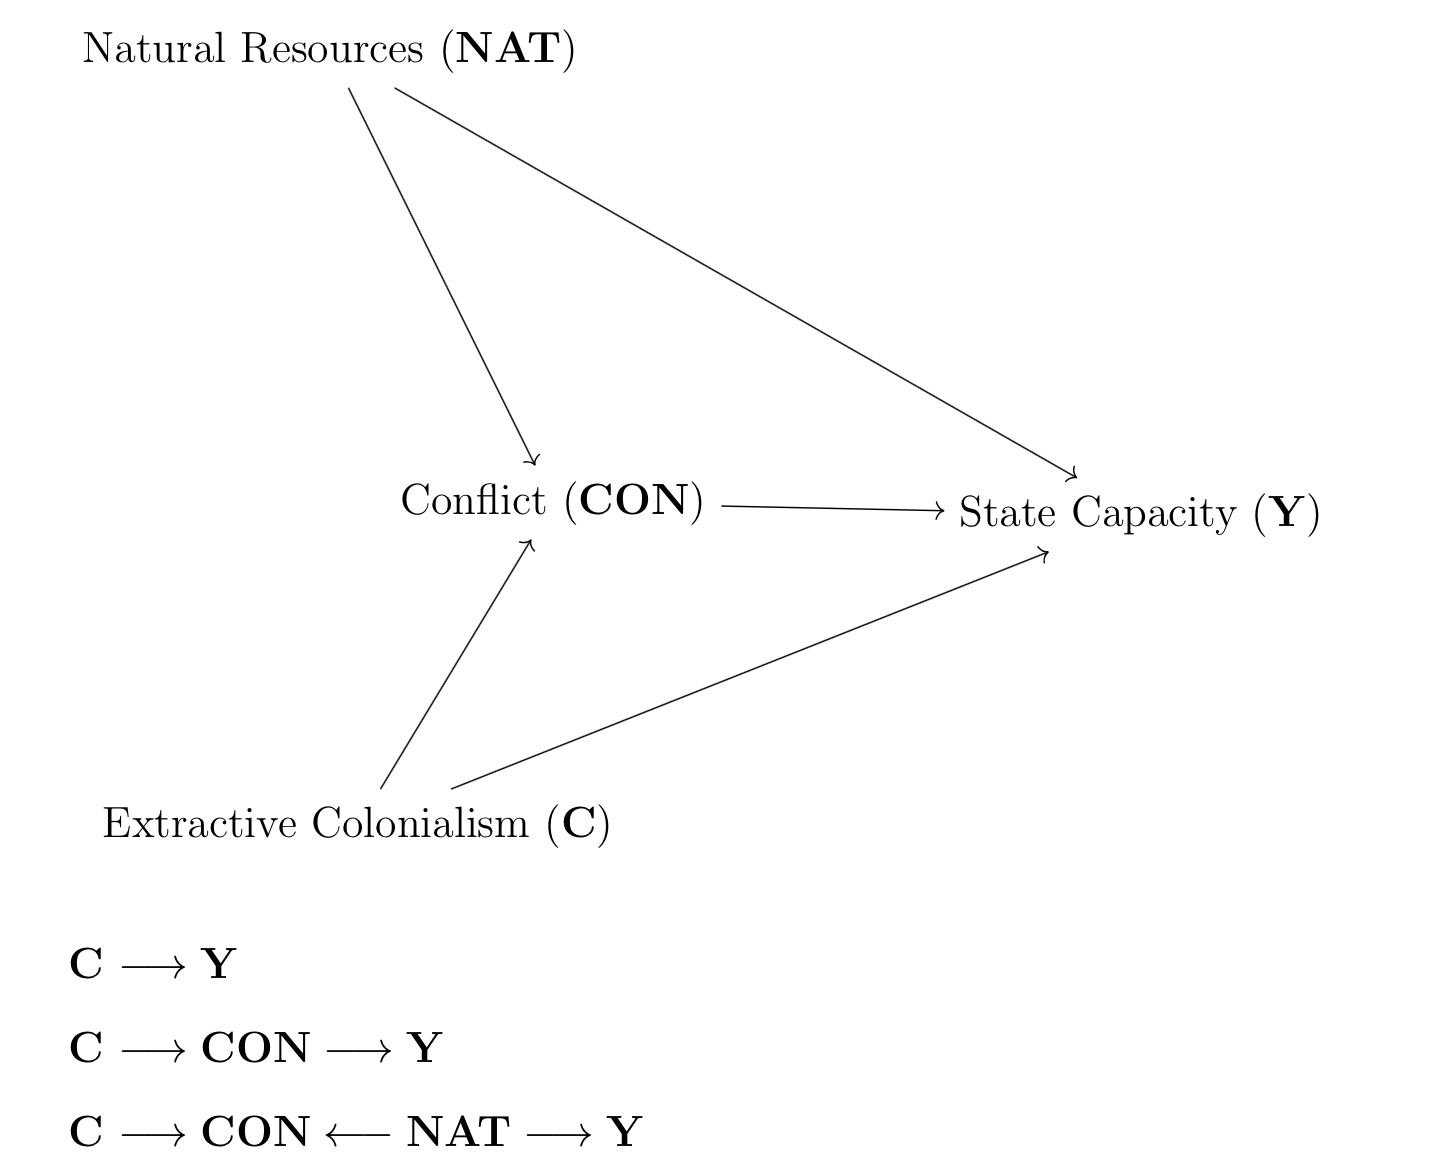
The above DAG shows the theoretical relationship between countries with histories of extractive colonialism (C) and their current state capaciy (Y). The DAG purposes a direct pathway (C -> Y), and a mediated path via the variable conflict (C -> CON -> Y), as well as a parthway with a collider (C -> CON <- NAT -> Y). In this model there are several backdoor pathways that needs to be controlled for in order to give less biased estimates.
Regression Discontinuity Design (RDD)
RDD is a quasi-experimental pretest-posttest research design that aims to determine the causal effects of interventions by assigning a cutoff or threshold above or below which an intervention is assigned for establishing causal inference that has exploded in popularity following the 1990s.
The main idea behind RDD is to compare the Local Avaerage Treatment Effect (LATE) of units who are randomly assigned a treatment or not. The effect of interest is measured at the cutoff, and are therefore "local."
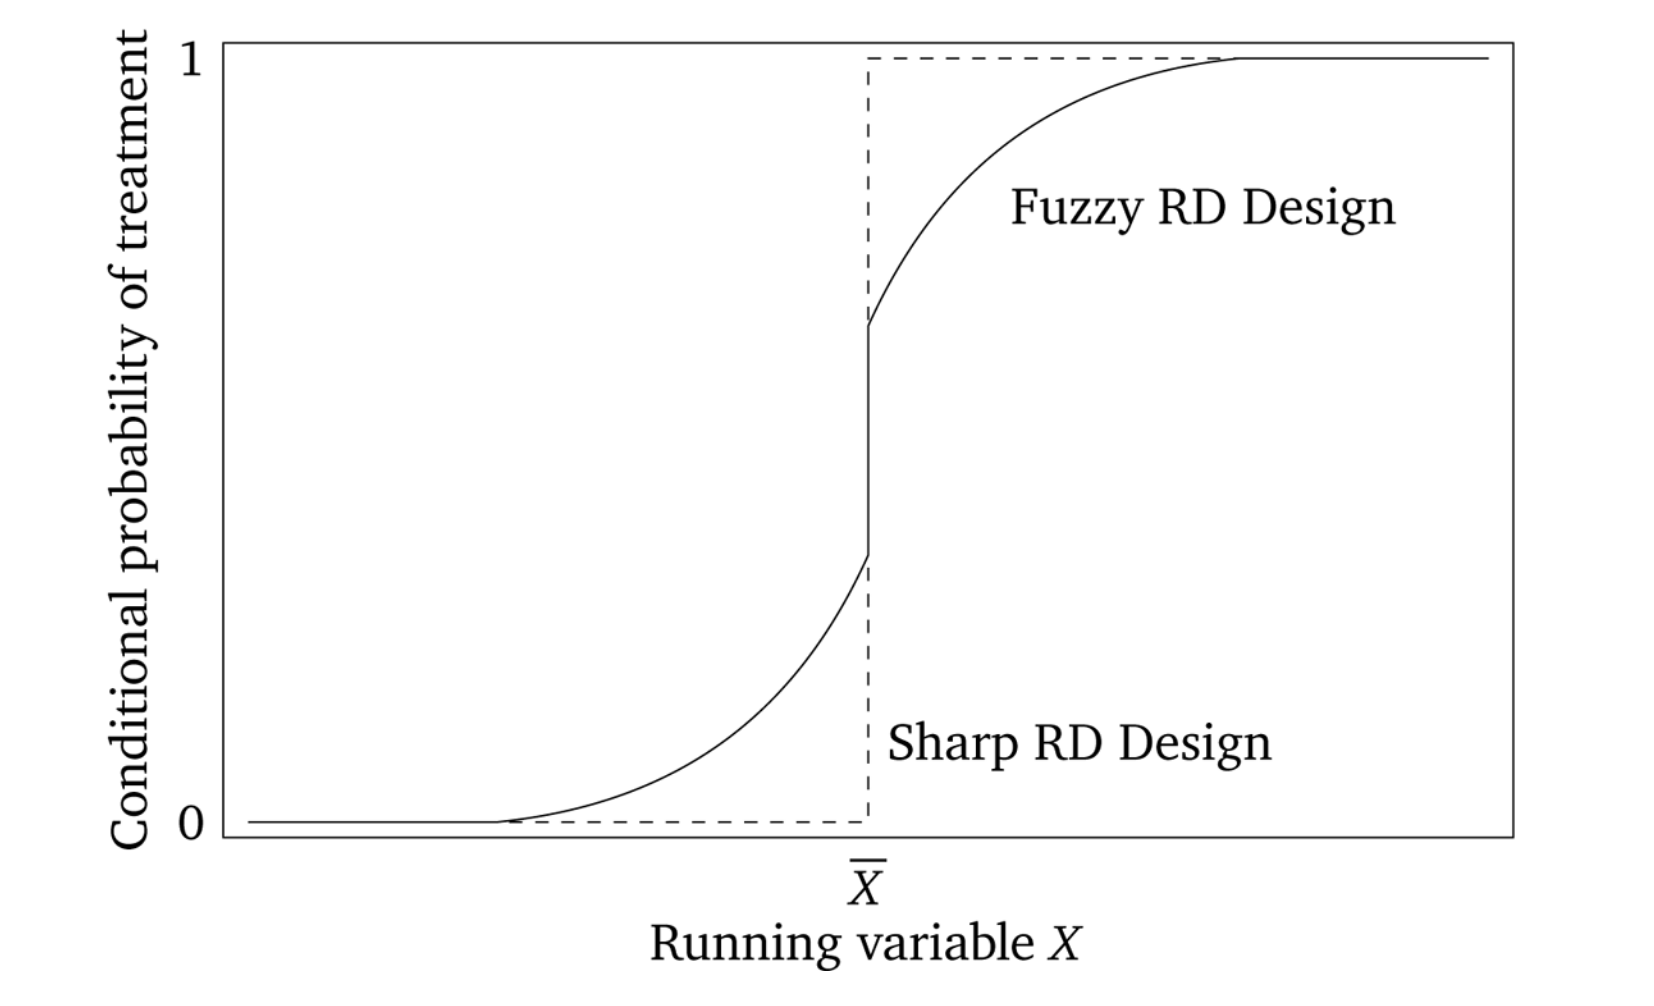
There are generally two types of RDD designs: Sharp and Fuzzy. In sharp RDD the cutoff is clear, with the treatment being given at the cutoff; while in fuzzy RDD, the units may be assinged the treatment surrounding the cutoff.
One of the most important assumptions of the RDD design is called the continuity assumption. It states that the expected potential outcomes are continuous (smooth) functions of the running variable X across the cutoff threshold. In other words, under the the lack of the treatmentthe expected potential outcomes wouldn’t have jumped; they would’ve remained smooth functions of X.
Instrumental Variables (IV)
Another popular quasi-experimental reasearch design is the use of instrumental variables, or IVs, which can be used when the variables of interest are correlated with the error term in Ordinary Least Squares (OLS) and ANOVA gives biased estimates. IVs (Z below) are variables highly correlated and explanatory of the explanatory variable (D below), however comepletely independent from the dependent variable (Y). In this regard, Z allows for the ubiased estimation of Y, as the treatment effect of D is uncovered by Z, despite unobserved variables (U).

There exists two different types of IV design, one with homogeneous treatment effects, and one with heterogenous treatment effects. The essential difference being that in a heterogeneous design the charateristics of the instrument may not effect every unit similarly.
The most imporant assumption of IV design is the exclusion criteria: The instrument (Z) is completely independent and uncorrelated with the dependent variable (Y).